At a glance
- Takes
- A payload holding a number
- Emits
- The same payload, unchanged
- Good for
- Watching an emitter's metric move while the flow runs
Set it up
Wire an emitter into it and pick the number to plot. Its Pass-through outlet carries the payload onward, so a Condition or a Notification can sit after the chart.
Configure
| Field | Default | What it does |
|---|---|---|
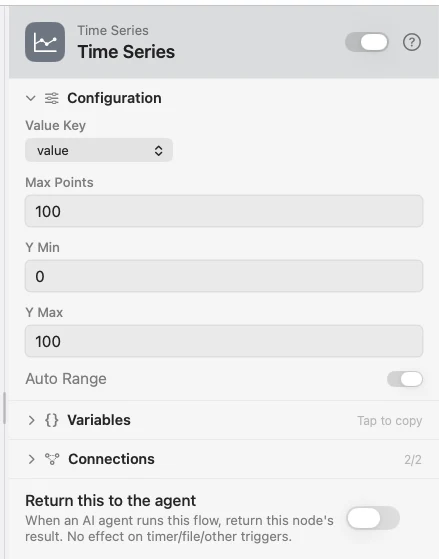
| Value Key | value | The payload key holding the number. Both emitters publish value, so this usually needs no change. |
| Max Points | 100 | How many points to keep before the oldest scroll off. |
| Auto Range | On | Fits the Y axis to the data. Turn it off to pin the axis. |
| Y Min · Y Max | 0 · 100 | The fixed axis, used when Auto Range is off. |
Example: chart CPU live
Resource Monitor samples CPU every two seconds. Time Series plots {{value}}. Log keeps the samples on the timeline.
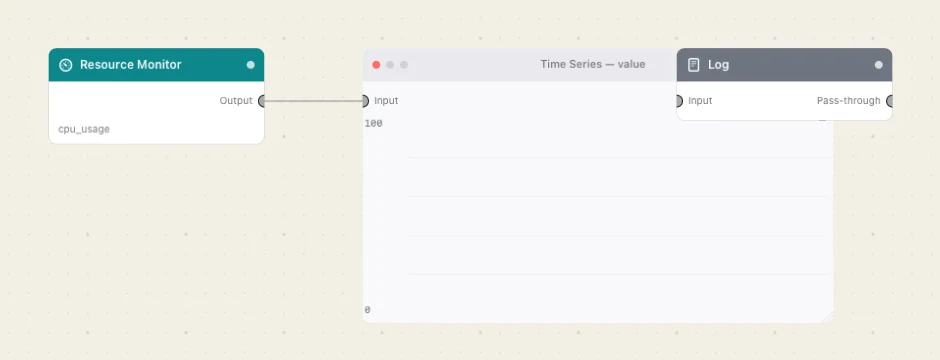
Paste this into the Flow Builder to get the same flow:
Sample my CPU every two seconds, chart it on a Time Series node, and log each sample.
Good to know
It falls back to value. If the key you named doesn't hold a number, the node looks for value before giving up — which is why an emitter wired straight in charts without configuration.
A tick with no number is skipped, not charted as zero. The payload still passes through.
The chart is per node card. Two Time Series nodes keep two independent series, so one flow can watch two numbers at once.