Open it
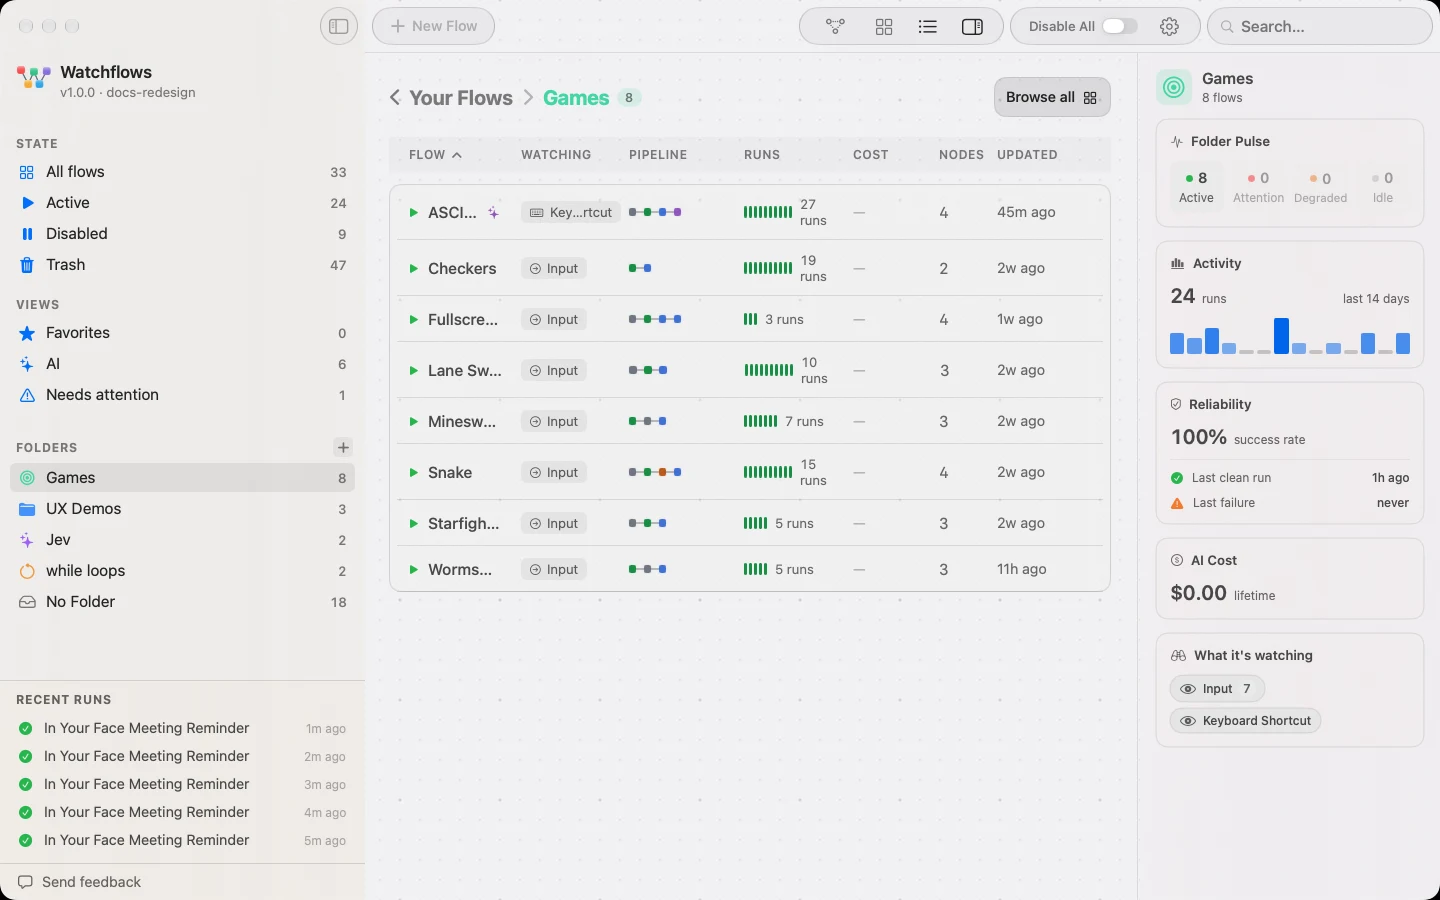
Click a folder in the sidebar. The dashboard mounts down the right of Home; the toolbar glyph beside the view switch hides and shows it, and dragging its edge resizes it between 220 and 450 points. Your width is remembered. Real folders only — All flows and No Folder carry no insights.
What the tiles say
| Tile | What it shows |
|---|---|
| Folder Pulse | The folder's flows counted as Active, Attention, Degraded or Idle |
| Activity | Runs over the last 14 days, one bar per day — hover a bar for its date and count |
| Reliability | Success rate, last clean run and last failure, all within that 14-day window |
| AI Cost | Lifetime AI spend, summed across the folder's flows |
| What it's watching | One chip per trigger the folder's flows use, with how many carry it |
Good to know
No AI, no estimates. Every figure folds run history, cost totals and trigger metadata already on your Mac. Nothing leaves the machine.
Activity and reliability are windowed; cost is not. A folder quiet for a fortnight reads — for success rate and never for last failure, while AI Cost stays the running lifetime total.